
#2 · Thrown Under the Bus: Power, Heat, and Other Lessons from Our 8×3090 Rig
NVIDIA’s phrase for a total PCIe failure is oddly gentle: GPU has fallen off the bus. It sounds like something that happens to a kid’s backpack on a school trip. Our logs preferred the drier variant, NVRM: GPU lost from the bus [NV_ERR_GPU_IS_LOST] — lost, as if the card might still turn up at some rest stop. Both messages mean the same thing: a graphics card that was part of an eight-GPU pool a moment ago has simply stopped existing as far as the operating system is concerned.
After several weeks of debugging, “fallen off” started to feel far too kind. Our GPU wasn’t falling off the bus. It was getting thrown under it.
In part one of this series we describe how we packed seven RTX 3090s and one RTX 3090 Ti onto a Supermicro H12SSL-i and fed them from four power supplies. This second part picks up where build articles usually stop: the machine boots, nvidia-smi shows eight cards, the model loads — and the system is still nowhere near stable.
The wall socket sees the whole rig
GPU telemetry is useful, but it only covers part of the machine. It says nothing about PSU efficiency, and nothing about what the CPU, motherboard, RAM, fans, and drives are drawing. So we measure power at the wall, with a Tasmota power meter sitting in front of the entire rig. The readings flow into our monitoring over MQTT.
At idle, the system draws roughly 450 watts. During inference the curve jumps around depending on model placement, prompt phase, and concurrency, with short spikes reaching about 3,100 watts. The chart shows an ordinary workday: long stretches with models running, interruptions, shifting loads, and in between the clearly visible idle baseline.

Two units are worth keeping cleanly apart here. Watts describe instantaneous power. Kilowatt-hours measure energy consumed over time. Over the past seven days our average came to 19.754 kWh per day. Spread across 24 hours, that works out to a mean continuous draw of about 823 watts:
19.754 kWh / 24 h = 0.823 kW ≈ 823 WThe idle share alone is substantial. If the rig ran 24 hours at 450 watts with no model load at all, that would be 10.8 kWh per day. The seven-day figure also includes the productive inference phases on top. If you want a cost number, plug in your own electricity tariff — we’re deliberately not printing one, because it would be misleading for anyone on a different contract in a different place.
The 3.1 kW spikes aren’t a theoretical sum of eight GPU TDPs either; they’re short events actually observed at the wall. These transients are exactly what matters for power distribution. A PSU can look generously sized on its nameplate and still misbehave in one specific grouping, with specific cables, under transient load.
Four PSUs — and still a power problem
Today, the auxiliary 6-/8-pin connectors of our GPUs are spread across four sources. The 1200 W ATX unit additionally feeds the motherboard, the CPU, and the slot power of all eight cards. A 1200 W HP supply carries three GPUs, the 1600 W HP module carries three more, and a 750 W HP unit we had lying around carries the last card.
That layout is the outcome of a debugging session, not a design. Originally, the aux connectors of four GPUs sat on the 1600 W server PSU. One card kept sporadically dropping out of the pool. The symptoms pointed at the data path: riser contact, PCIe adapter, bus errors, driver — all plausible suspects, because what the OS saw was a vanishing PCIe component. Why on earth would the power supply be the culprit?
Moving one GPU over to the spare 750 W HP unit made exactly that failure disappear. This doesn’t establish a general rule that a 1600 W PSU can’t feed four RTX 3090s. What it does establish is narrower and, for us, more useful: this particular supply branch, with our wiring and load distribution at the time, was unstable. After we relieved it, it wasn’t.
The episode shows why summing nameplate ratings only tells half the story. Our four PSUs add up to 4,750 watts on paper. The rig never pulls 4,750 watts continuously, and the number says nothing about how evenly the load lands on individual cables, breakout outputs, and GPUs. With eight cards, the total isn’t what has to be right — the mapping has to hold up under real load.
Summer is a very honest benchmark
The first frame got all the cards running quickly, but it packed them too close together. In winter, a build like that can pass unnoticed. In summer, intake temperatures climb and every GPU inhales part of its neighbor’s exhaust. These days there are several fans parked directly in front of the rig, and a new frame with wider spacing is in the works.
The thermal problem can’t be pinned to any single temperature reading. On RTX 3090 cards, the GDDR6X memory is the part to watch. In one documented case, the GPU core sat at only about 76 °C while the memory was already throttling hard. The core clock dropped all the way to 300 MHz, and the inference speed of a TP4 Qwen setup fell from roughly 65 to 17 tokens per second.
From an application’s point of view this is a nasty failure mode: nothing crashes. The model keeps answering, just suddenly four times slower. If your health check is “the container is up and all GPUs show in nvidia-smi,” you’ll find no explanation whatsoever.
So we watch several values together:
- GPU core temperature,
- memory junction / memory temperature, where available,
- current SM clock,
- per-card power draw,
- NVIDIA throttle reasons,
- inference throughput over a longer window.
Short benchmarks won’t catch this. A card can hold full clocks through a 30-second test and only fold thermally after a long prefill or several minutes of decode. In our experience, a real agent run or a 100k-context test tells you far more than a short prompt with 256 output tokens.
Power limits: small cost, real headroom
As a safety net we run the RTX 3090s with a power limit of about 250 watts and the RTX 3090 Ti at about 300 watts. A systemd service reapplies these values at boot, because power limits aren’t guaranteed to survive a restart.
The impact on our measured inference performance is smaller than the wattage gap suggests. In single-stream operation the loss was practically unmeasurable: roughly 82.4 instead of 83 tokens per second in that configuration. Under four parallel streams the limit cost around four percent. In exchange, one problem card ran about eight degrees cooler.
The workload explains why. Decoding large LLMs on these cards is often bounded by memory bandwidth and communication, not by a sustained maximum core clock. The power limit mostly clips short prefill and load spikes. It’s no substitute for airflow or clean contacts, but it buys thermal and electrical headroom at very little throughput cost.
These are measurements on our rig, not a guarantee for every 3090 and every model. Different kernels, longer prefill phases, or more compute-heavy workloads may behave differently. The combination of temperature, clock, and actual token rate remains the yardstick.
When cables press on cables
Our most stubborn bus error lived at GPU 2, physically in SLOT4, PCI address 42:00.0. Under multi-agent load, this position first collected PCIe AER errors. Later, the card vanished from the bus entirely. Since a failure like that looks dramatic from the software side, that’s where the debugging started too.
We tried different KV configurations, driver paths, and parallelization variants. We changed the power distribution. We swapped the PCIe data cable with another position. Finally we swapped the GPU itself. The fault stayed put — at the position. That largely ruled out the model, the quantization, and the specific card.
The fix turned out to be mechanical. Neighboring cables were pressing down on this position’s riser cable, and that pressure stressed the connector. Under heavy load, a marginal contact turned first into a PCIe replay problem and eventually into a bus drop. After we relieved the cable and stabilized the routing with small supports, an eleven-minute multi-agent stress test with 43 measurement points and three concurrent requests ran clean: no new AER errors, no bus drop, even with GPU 2 spiking to about 320 watts.
This is why we don’t buy the cheapest risers. A fully fed PCIe 4.0 link is far more sensitive than a slow mining connection. Expensive risers, mind you, are not insurance against sloppy assembly — bend radius, tension, lateral pressure, and connector support are all still part of the build.
Another failure was less subtle: a needed x8-to-x16 adapter simply didn’t work. We needed those adapters to attach GPUs to the board’s two physical x8 connectors. Here, too, the system-level problem initially looked much bigger than the broken part. A black sliver of PCB has no status page and writes no helpful log line. It just makes sure plenty gets logged somewhere else.
What “fallen off the bus” actually means
PCI Express ships its own error counters via AER, Advanced Error Reporting. On Linux, you can inspect them for a PCI address like this:
sudo lspci -s 42:00.0 -vvv | grep 'CESta:'Our riser problem escalated in a textbook sequence. First came Timeout+: an expected completion or replay didn’t arrive in time. Under continued load, Rollover+ followed — the error counter had already overflowed. After that, the GPU could disappear completely. lspci would then show, among other things, Unknown header type 7f, and the driver reported:
NVRM: GPU lost from the bus [NV_ERR_GPU_IS_LOST]In other crash chains we saw Xid 13 and Xid 154. These codes are not a full root-cause diagnosis. They mark where NVIDIA or the kernel noticed the failure. A Xid can be triggered by a software bug, or it can be the downstream consequence of an unstable PCIe link.
The truly treacherous part is the window before the full drop. nvidia-smi may still report eight cards, the container may still show running, the API may still hold its port open. Internally, a worker is already waiting for data that will never arrive in time across the failing link. The application then sees an RPC timeout or a dead engine, while the actual cause sits well below Docker and vLLM.
Recovery depends on the same boundary. If only the inference engine died after a timeout, restarting the container is usually enough. If the GPU is missing from the PCIe tree, or lspci shows header 7f, there is nothing Docker can repair. Then the mechanical or electrical fault has to be fixed first, followed by a clean host reboot. After boot, we don’t just check that eight GPUs are back in nvidia-smi — we check the AER bits and put load on the affected path again. A system that enumerates eight cards at idle has passed exactly half the test.
Link width is not link health
In PCIe diagnostics, two seemingly unambiguous readings will happily lead you astray:
- 2.5 GT/s, i.e. Gen1, at idle: this can be perfectly normal link power saving. Many of our GPUs downshift the link speed at idle and retrain to Gen4 under load.
- x8 with the tag
downgraded: SLOT2 and SLOT4 on the H12SSL-i are natively x8. Some tools compare against the GPU’s x16 capability and label x8 “downgraded,” even though the slot is wired exactly as designed.
What matters is the state under load. So beyond reading LnkSta, we deliberately push data to every single GPU. In our tests, a healthy link sat in the ballpark of 25 GB/s. A faulty path collapsed to about 0.08 GB/s — 80 MB/s. The machine didn’t necessarily crash. The whole pipeline group was simply reduced to the speed of its slowest stage: an inference run that had been doing around 80 tokens per second dropped to about three.
For multi-GPU systems, a per-GPU host-to-device bandwidth test is one of the most valuable diagnostics there is. It answers a simple question: does each GPU reach a plausible H2D rate over its actual path? Averages across all cards can hide a single broken link entirely.
Our dashboard: more than pretty bars
With eight GPUs, four PSUs, and several models, the command line gets unwieldy fast. So we built a dashboard that pulls the state of the entire rig into one place: CPU, RAM, disk space, VRAM in use, total power draw, temperatures, GPU utilization, PCIe link status, AER flags, and the current model placement. It also makes starting and stopping models comfortable.
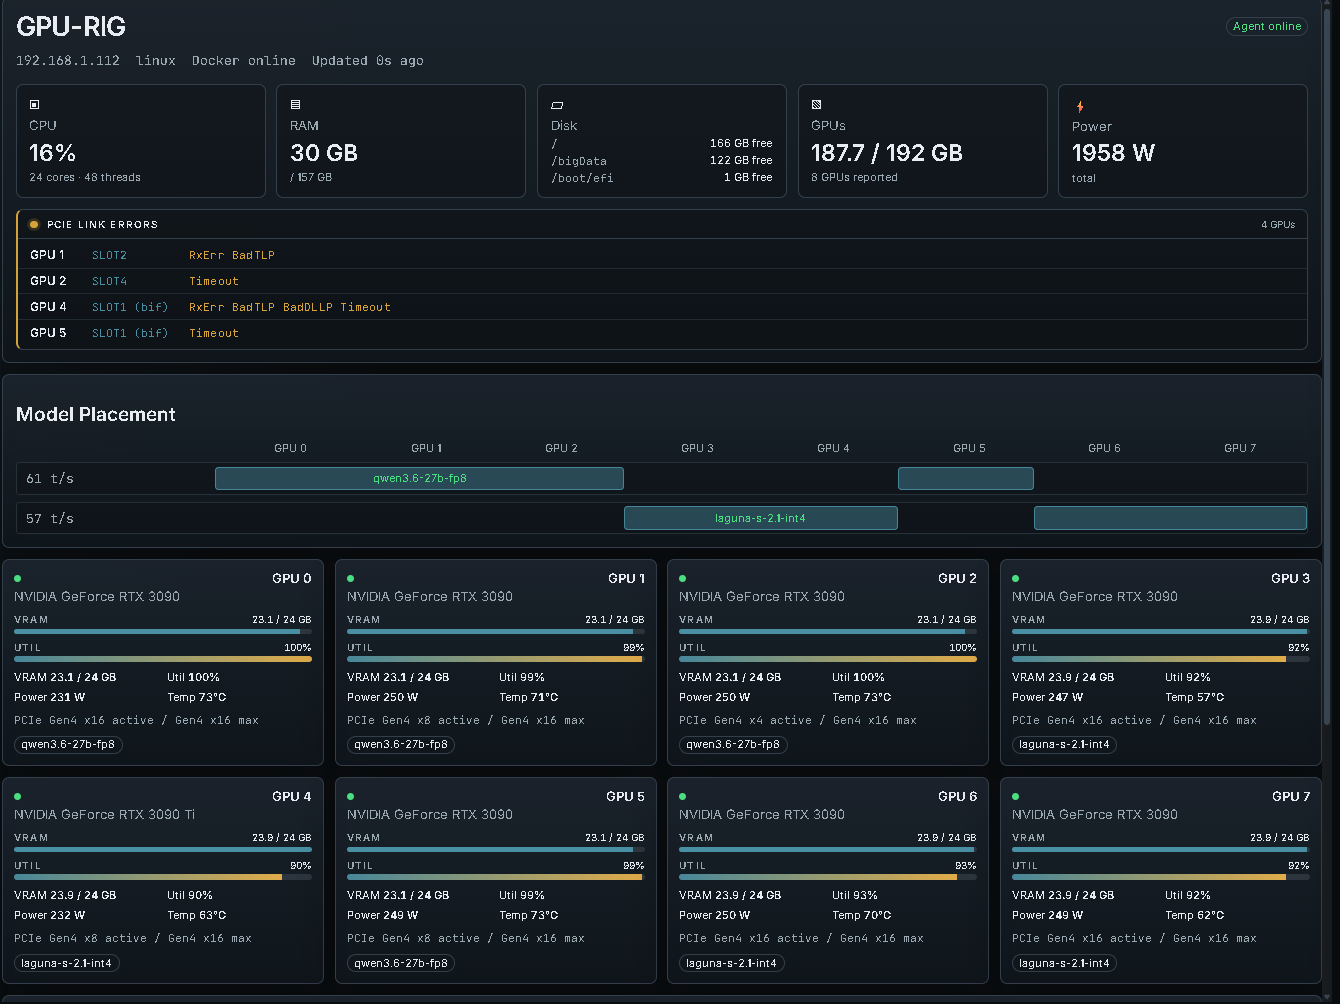
The snapshot shown is a good example of a productive state: the rig is drawing about 1,958 watts in total, 187.7 of 192 GB of VRAM are in use, and all eight GPUs are working. Qwen3.6-27B-FP8 occupies GPUs 0, 1, 2, and 5; Laguna S 2.1 sits on 3, 4, 6, and 7. Core temperatures range from roughly 57 to 73 °C.
At the same time, the PCIe section flags error bits on four GPUs. That doesn’t automatically mean four cards are failing right now — AER bits can stay set long after an event. What counts is change and its correlation with load: does a fresh Timeout+ appear? Does a position tip over into Rollover+? Does the counter climb exactly when several requests run concurrently? The dashboard makes those connections visible; interpreting them is still our job.
The active width of x4 visible on GPU 2 is likewise an observation, not a board spec. SLOT4 is natively wired x8, so a lower width negotiated under load belongs on the checklist. That’s exactly why the dashboard displays active and maximum reported link width separately.
The model placement view earns its keep too. When one four-GPU group slows down, we can see immediately which physical card, which slot, and which model are involved. The dashboard ties together three layers that normally stay separate during debugging: application, GPU telemetry, and PCIe hardware.
P2P: the obvious optimization that made everything worse
Our rig has no NVLink, and the eight GPUs are spread across four PCIe root complexes. The intuitive move is to enable peer-to-peer access between the cards so data can skip the host memory path. We tested this with a patched NVIDIA open driver that reported GeForce P2P as available.
The result was worse than a cleanly disabled P2P path. Across root-complex boundaries, BAR1 transfers sometimes delivered zeros. vLLM produced hangs and engine crashes; an ik_llama path produced corrupt output riddled with null bytes. A topology test could happily report “P2P OK” while the data being transported was garbage.
Our production setup therefore runs the proprietary stock driver 580.126.20 and avoids P2P on purpose. For vLLM, that includes among other things:
NCCL_P2P_DISABLE=1
NCCL_CUMEM_ENABLE=0
VLLM_ALLREDUCE_USE_SYMM_MEM=0
--disable-custom-all-reduce
The last flag matters because vLLM’s own custom all-reduce path is not stopped by NCCL_P2P_DISABLE=1 alone. On a different topology — PCIe switches, professional GPUs — P2P may well make sense. On our four-root-complex GeForce rig, the robust host/NCCL path is the better choice.
A second driver lesson was just as concrete: after every driver change, we reboot the host completely. Live swaps via modprobe -r and reloading left behind GPU, UVM, DMA, or BAR states in which vLLM still looked plausible while raw host-staging paths deterministically produced corrupt tokens. A clean reboot fixed it. nvidia-smi alone had given no hint that the state was inconsistent.
Not every slow system has a GPU problem
While we were working on the rig, the network link kept intermittently dropping from gigabit to 100 Mbit/s and flapping between the two speeds. The cause was a defective cable on eno1. After swapping it for a Cat6 cable, model copies ran at about 112 MB/s again.
For the pure decode rate of an already loaded model, this was never the main bottleneck. For downloads, model launches, and distributed workflows, the system still felt needlessly sluggish. As side quests go, it fit the rest of the project perfectly: in a complex rig, the most conspicuous component is rarely the guilty one.
The second frame will be less photogenic — and better
Our next build gets more space between the GPUs, cleaner cable routing, and fixed strain-relief points for the risers. The fans will push air through defined gaps instead of fighting a nearly solid wall of backplates. PSU groups and GPU positions will be labeled so that a dashboard warning traces directly to a cable, a breakout output, and a physical slot.
Monitoring stays part of the construction. Temperatures, clocks, and token rate expose thermal problems; AER counters and bandwidth tests report on the health of the PCIe paths; the Tasmota meter captures the behavior of the system as a whole. No single one of these measurements is enough. Together, they turn eight used graphics cards into an operable compute system — and, with a bit of luck, keep every last one of them safely on the bus.